

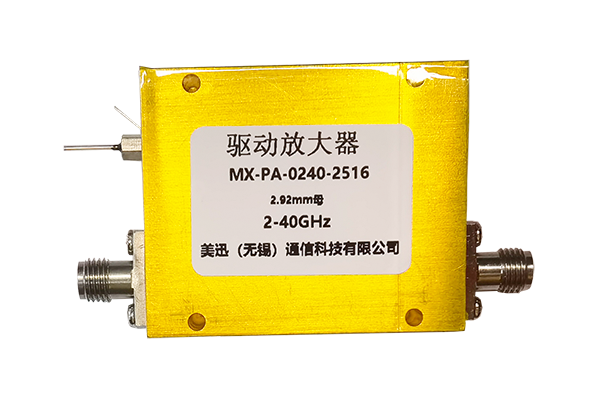



The complete guide to Low Noise Amplifiers (LNAs): technical principles, applications, selection criteria, and leading manufacturers for 5G, radar, satellite, and SDR systems.
Sep 18 ,26


5G communication testing, wireless terminal automated testing
Aerospace communication systems
Precision measurement equipment, radio frequency signal control of radar transmitters
Communication and navigation systems
Optical communication module-related testing
Interconnection of wireless communication base stations
Low Noise Amplifiers (LNAs) are critical components in RF and microwave systems, serving as the first active gain stage in receivers and significantly impacting overall system sensitivity. This comprehensive guide provides RF engineers with the essential knowledge needed to select the optimal LNA for their specific application requirements.
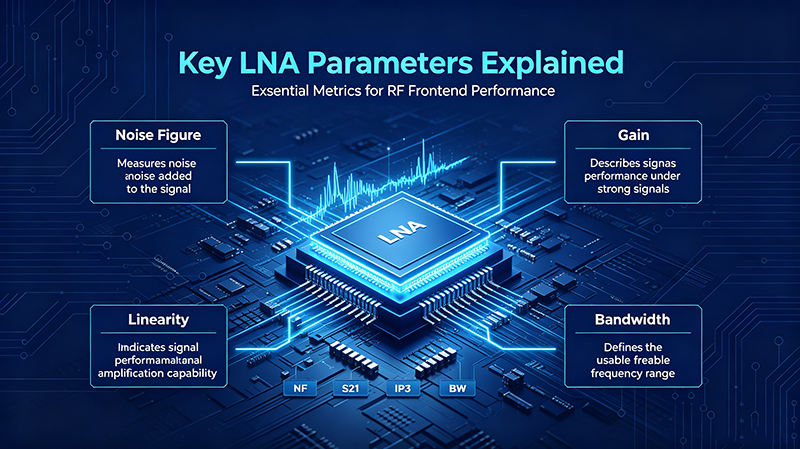
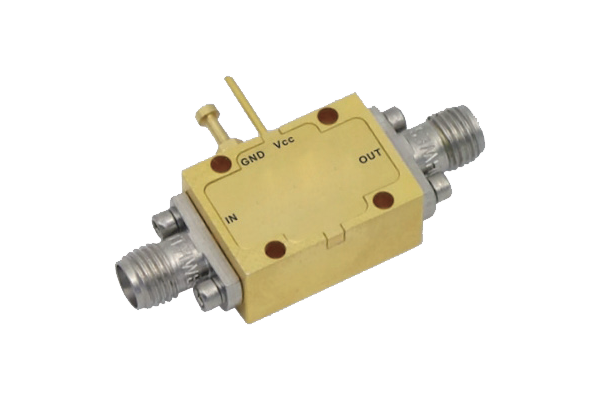
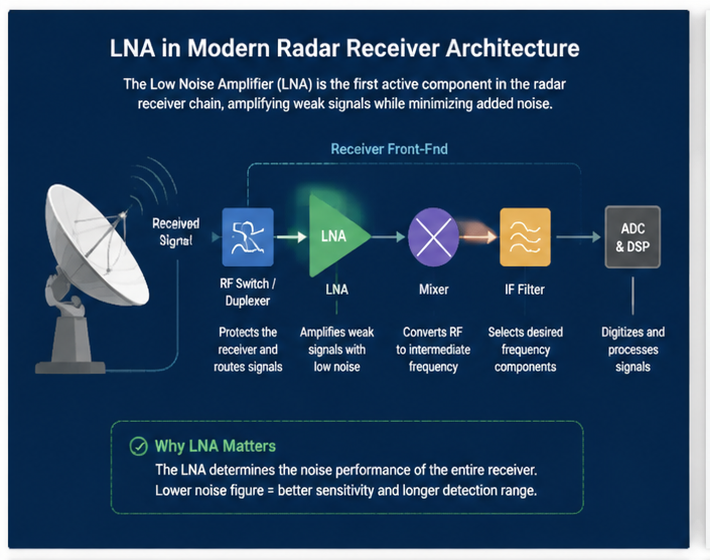
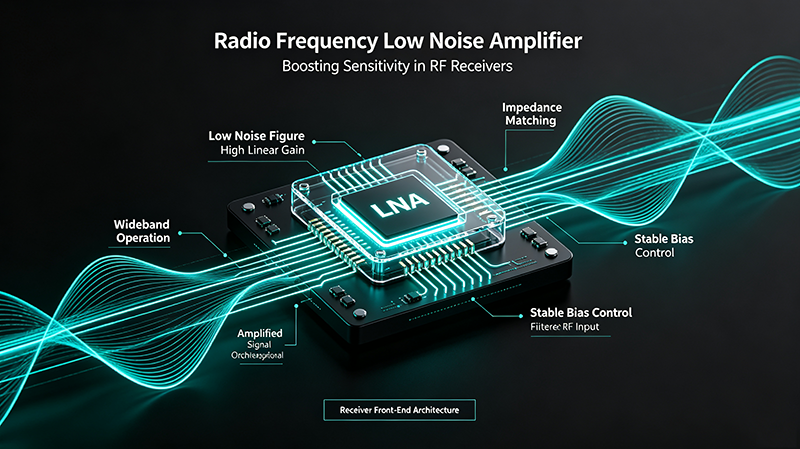
A Low Noise Amplifier is a specialized electronic amplifier designed to amplify very weak signals from RF antennas or sensors while introducing minimal additional noise. LNAs are typically placed at the front end of communication receivers, where they must boost signal strength without degrading the signal-to-noise ratio (SNR).
The LNA's position in the signal chain makes it crucial for overall system performance. Any noise added by the LNA cannot be removed by subsequent amplification stages, making LNA selection one of the most critical decisions in RF system design.
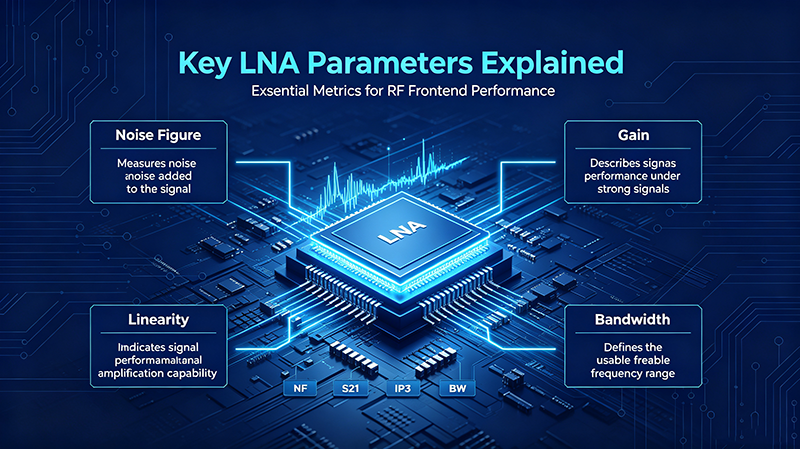
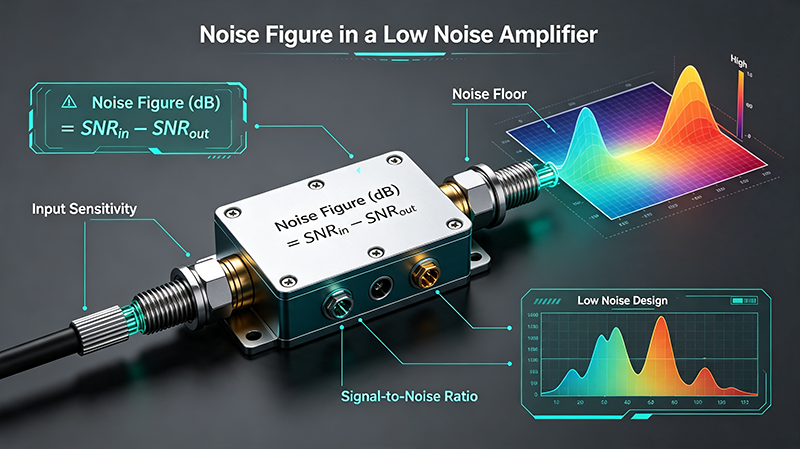
Noise Figure is the primary figure of merit for LNAs, representing the degradation of SNR as the signal passes through the amplifier. It is expressed in decibels (dB) and lower values indicate better performance.
NF = 10 log10 (SNR_input / SNR_output)
For cascaded systems, the total noise figure is dominated by the first stage. This is why LNA selection is critical for system sensitivity.
Typical LNA noise figures range from 0.5 dB for premium gallium arsenide (GaAs) pHEMT devices to 3-5 dB for silicon germanium (SiGe) or complementary metal-oxide-semiconductor (CMOS) implementations.
LNA gain, measured in decibels, determines how much the amplifier boosts the input signal. Higher gain reduces the impact of noise from subsequent stages, but excessive gain can lead to compression and intermodulation issues.
Common gain values range from 10 dB to 40 dB, with 20 dB being a typical specification for many applications. The optimal gain depends on system architecture and subsequent component noise figures.
Noise temperature (Te) is an alternative way to express noise performance, particularly useful at cryogenic temperatures. It relates to noise figure through:
Te = T0 (10^(NF/10) - 1), where T0 = 290K
The 1dB compression point indicates the input power level at which the amplifier gain drops by 1 dB from its linear response. This parameter defines the boundary between linear and nonlinear operation.
IP3 measures linearity performance and predicts intermodulation distortion. Higher IP3 values indicate better linearity. The spurious-free dynamic range (SFDR) is directly related to IP3.
Voltage Standing Wave Ratio (VSWR) indicates impedance matching quality. A VSWR of 1:1 represents perfect match, while higher values indicate reflection losses. Most LNAs require 50-ohm system impedance.
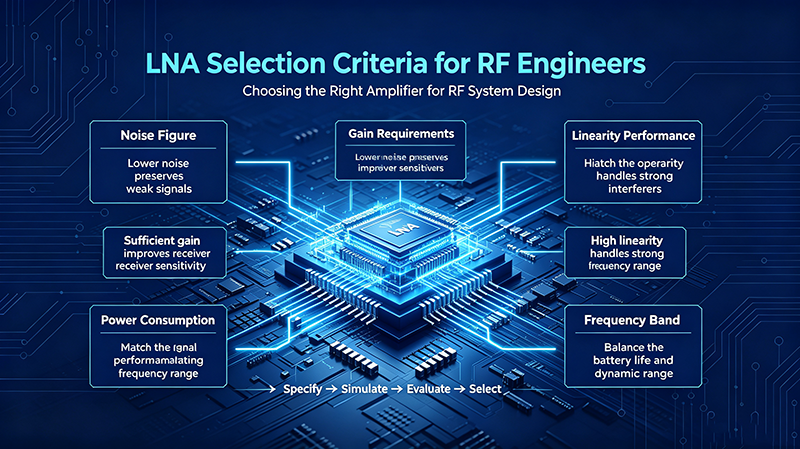
Before selecting an LNA, define your system requirements clearly:
| Frequency Band | Typical NF | Common Technology | Typical Applications |
|---|---|---|---|
| L-band (1-2 GHz) | 0.6-1.5 dB | GaAs pHEMT, SiGe | GPS, cellular, radar |
| S-band (2-4 GHz) | 0.8-2.0 dB | GaAs pHEMT, InP | Weather radar, communications |
| C-band (4-8 GHz) | 1.0-2.5 dB | GaAs pHEMT, GaN | Satellite comms, radar |
| X-band (8-12 GHz) | 1.2-3.0 dB | GaAs pHEMT, GaN | Military radar, aerospace |
| Ku-band (12-18 GHz) | 1.5-3.5 dB | GaAs pHEMT, GaN | Satellite TV, VSAT |
| Ka-band (26-40 GHz) | 2.0-4.0 dB | InP, GaN, SiGe | 5G mmWave, automotive radar |
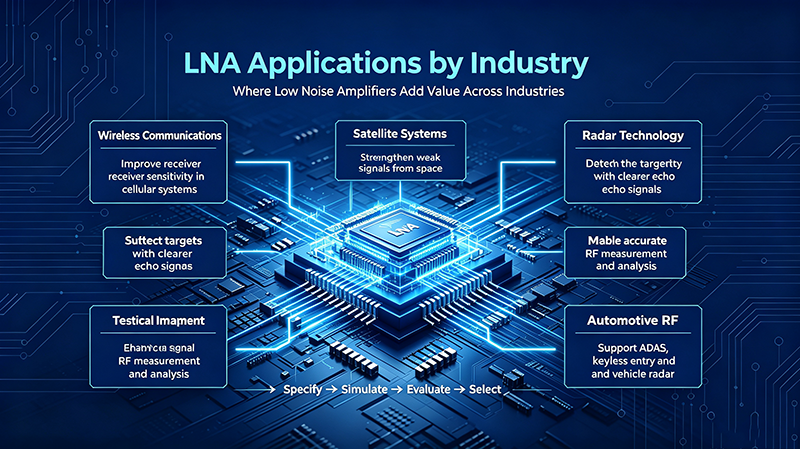
Cellular base stations, Wi-Fi routers, Bluetooth receivers, and IoT devices require LNAs with low power consumption and moderate noise figures for high-volume deployment.
Weather radar, automotive radar, and military systems demand high linearity and robust blocking performance to handle strong clutter returns and interference.
Ground stations and satellite receivers require extremely low noise figures to detect weak signals from orbit, often using cryogenic cooling for ultra-low noise temperatures.
Spectrum analyzers and network analyzers use precision LNAs with excellent gain flatness and high dynamic range for accurate signal analysis.
MRI systems and medical sensors employ LNAs with high linearity and excellent thermal stability for reliable diagnostic equipment operation.
77 GHz and 79 GHz automotive radar systems require compact, high-frequency LNAs with excellent temperature stability and reliability.
| Technology | Noise Figure | Frequency | Power | Linearity | Cost |
|---|---|---|---|---|---|
| GaAs pHEMT | Excellent (0.5-1.5 dB) | DC-60 GHz | Low | Good | Medium-High |
| InP HEMT | Best (0.3-0.8 dB) | DC-100+ GHz | Low | Good | High |
| GaN HEMT | Good (1.5-3 dB) | DC-40 GHz | High | Excellent | Medium-High |
| SiGe BiCMOS | Good (1-2.5 dB) | DC-30 GHz | Medium | Good | Low-Medium |
| CMOS | Moderate (2-5 dB) | DC-20 GHz | Low | Moderate | Low |
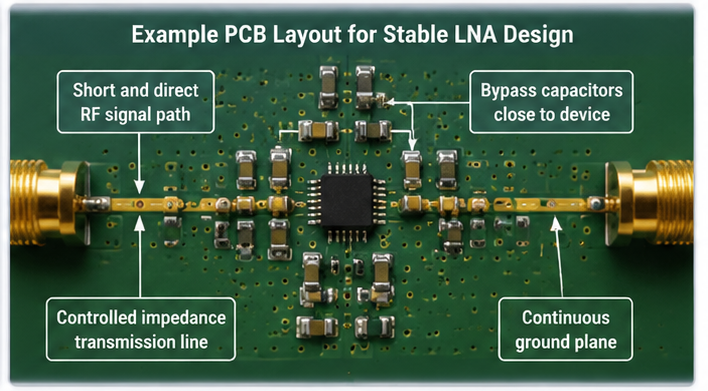
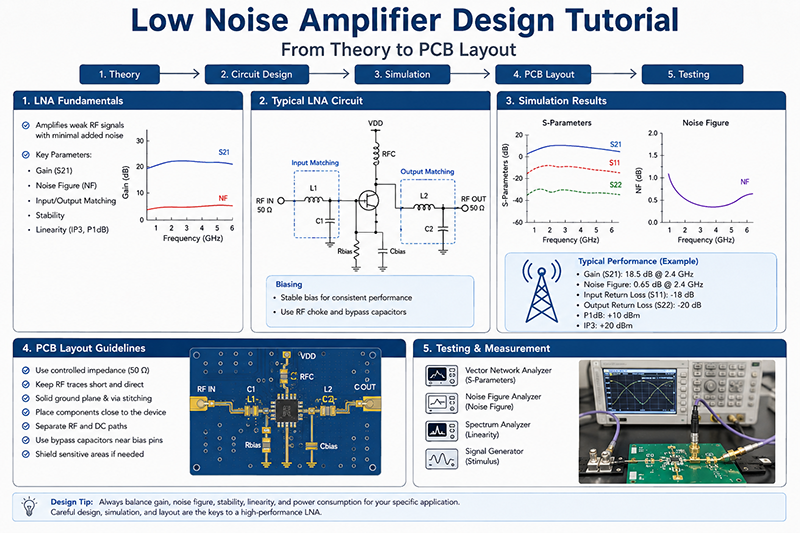
Achieving optimal noise figure requires proper input impedance matching. Use high-quality inductors and capacitors for matching networks, and ensure adequate bypassing for bias lines to prevent oscillations.
LNA performance degrades with temperature. Provide adequate heat sinking and consider temperature compensation techniques for applications with wide thermal ranges.
Apply gate bias before drain bias to prevent device damage. Many modern LNAs include built-in bias sequencing and protection circuits.
Calculate total system noise figure using Friis formula:
NF_total = NF1 + (NF2-1)/G1 + (NF3-1)/(G1*G2) + ...
Ensure the LNA provides at least 15-20 dB of gain to dominate subsequent stage noise contributions effectively.
Low Noise Amplifier selection requires careful consideration of multiple parameters including noise figure, gain, linearity, frequency range, and power consumption. Understanding your system requirements and performing proper cascade analysis will ensure optimal LNA selection for your specific application.
Whether designing for 5G wireless infrastructure, satellite communications, automotive radar, or industrial sensing systems, the principles outlined in this guide will help you navigate the LNA selection process effectively. Always consider the trade-offs between noise performance, linearity, power consumption, and cost when making your final selection.
For specialized applications requiring ultra-low noise temperatures, consult with manufacturers about cryogenic LNA solutions. For high-volume commercial applications, balance performance requirements against manufacturing cost and consistency.
Our technical team specializes in RF component selection and can help you find the optimal LNA solution for your specific requirements.
Contact Our RF Engineers
High-tech Enterprise, Feifeng Talent
Chief Engineer Wang graduated with a master's degree in high-power microwave from the Institute of Electronics, University of Chinese Academy of Sciences.
View Full Profile